New Debugging and Profiling Features in Visual Studio (v17.13)
Debugging and Profiling Features in Visual Studio v17.13
- Smarter exception and variable analysis:
- GitHub Copilot Exception Analysis and Variable Analysis provide sharper, context-aware insights to help identify errors more quickly and accurately.
- AI-Powered Parallel Stacks window:
- Auto-Summarize feature generates AI-based summaries in Parallel Stacks for better understanding of thread activities during parallel debugging.
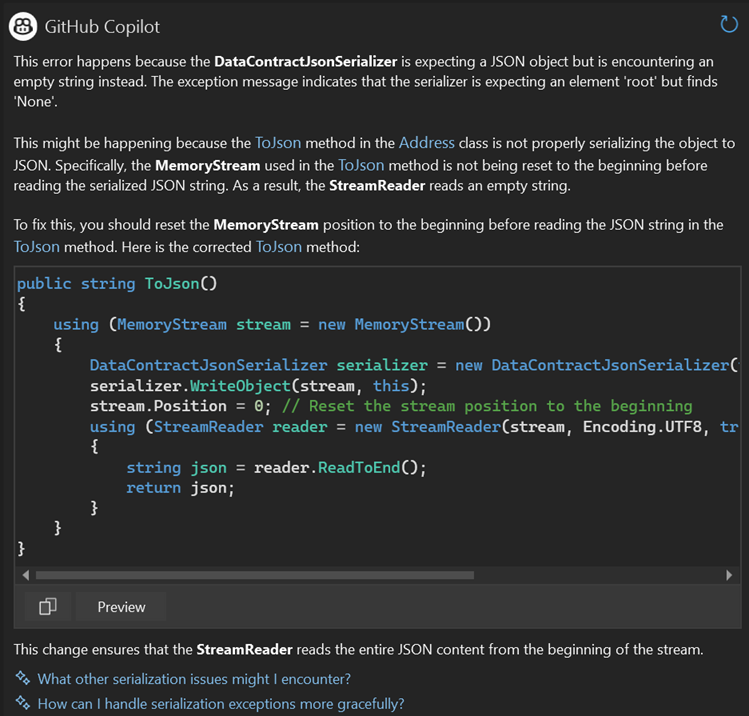
- GitHub Copilot Assisted Debugging Features:
- Receive AI-generated LINQ queries for customized data filtering with syntax highlighting for easier reading.
- Profiling Features:
- Targeted Instrumentation for native code:
- Instrumentation tool now offers targeted instrumentation for native code, improving performance monitoring and issue spotting.
- Multiprocess Analysis with Color-Coded Swimlanes in CPU Usage:
- CPU Usage tool now supports multiprocess analysis with color-coded swimlanes for each process, simplifying resource usage visualization and performance tuning.
- Targeted Instrumentation for native code:
Overall, Visual Studio v17.13 introduces advanced debugging and profiling capabilities, streamlining troubleshooting and performance optimization processes for developers.